
Basics of Mass Spectrometry
Mass spectrometry has been described as the smallest scale in the world, not because of the mass spectrometer's size but because of the size of what it weighs -- molecules. Over the past decade, mass spectrometry has undergone tremendous technological improvements allowing for its application to proteins, peptides, carbohydrates, DNA, drugs, and many other biologically relevant molecules. Due to ionization sources such as electrospray ionization and matrix-assisted laser desorption/ ionization (MALDI), mass spectrometry has become an irreplaceable tool in the biological sciences. This chapter provides an overview of mass spectrometry, focusing on ionization sources and their significance in the development of mass spectrometry in biomolecular analysis.
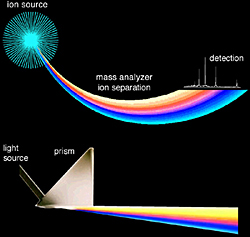
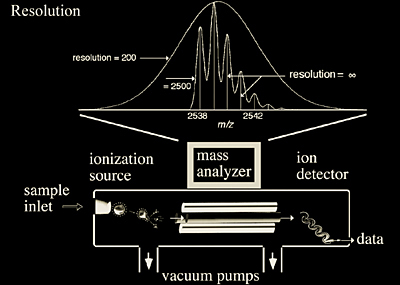
A mass spectrometer determines the mass of a molecule by measuring the mass-to-charge ratio (m/z) of its ion. Ions are generated by inducing either the loss or gain of a charge from a neutral species. Once formed, ions are electrostatically directed into a mass analyzer where they are separated according to m/z and finally detected. The result of molecular ionization, ion separation, and ion detection is a spectrum that can provide molecular mass and even structural information. An analogy can be drawn between a mass spectrometer and a prism, as shown in Figure 1.1. In the prism, light is separated into its component wavelengths which are then detected with an optical receptor, such as visualization. Similarly, in a mass spectrometer the generated ions are separated in the mass analyzer, digitized and detected by an ion detector (such as an electron multiplier, Chapter 2).
So What is Mass Spectrometry?
John B. Fenn, the originator of electrospray ionization for biomolecules and the 2002 Nobel Laureate in Chemistry, probably gave the most apt answer to this question:
Mass spectrometry is the art of measuring atoms and molecules to determine their molecular weight. Such mass or weight information is sometimes sufficient, frequently necessary, and always useful in determining the identity of a species. To practice this art one puts charge on the molecules of interest, i.e., the analyte, then measures how the trajectories of the resulting ions respond in vacuum to various combinations of electric and magnetic fields.
Clearly, the sine qua non of such a method is the conversion of neutral analyte molecules into ions. For small and simple species the ionization is readily carried by gas-phase encounters between the neutral molecules and electrons, photons, or other ions. In recent years, the efforts of many investigators have led to new techniques for producing ions of species too large and complex to be vaporized without substantial, even catastrophic, decomposition.
Some Basics
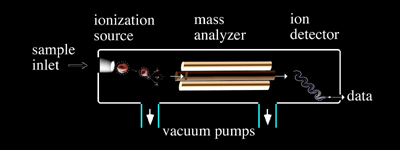
Four basic components are, for the most part, standard in all mass spectrometers (Figure 1.2): a sample inlet, an ionization source, a mass analyzer and an ion detector. Some instruments combine the sample inlet and the ionization source, while others combine the mass analyzer and the detector. However, all sample molecules undergo the same processes regardless of instrument configuration. Sample molecules are introduced into the instrument through a sample inlet. Once inside the instrument, the sample molecules are converted to ions in the ionization source, before being electrostatically propelled into the mass analyzer. Ions are then separated according to their m/z within the mass analyzer. The detector converts the ion energy into electrical signals, which are then transmitted to a computer.
Sample Introduction Techniques
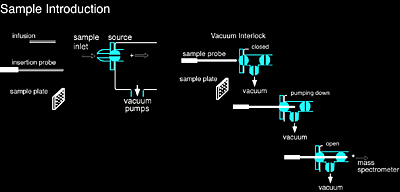
Sample introduction was an early challenge in mass spectrometry. In order to perform mass analysis on a sample, which is initially at atmospheric pressure (760 torr), it must be introduced into the instrument in such a way that the vacuum inside the instrument remains relatively unchanged (~10-6 torr). The most common methods of sample introduction are direct insertion with a probe or plate commonly used with MALDI-MS, direct infusion or injection into the ionization source such as ESI-MS.
Direct Insertion
Using an insertion probe/plate (Figure 1.3) is a very simple way to introduce a sample into an instrument. The sample is first placed onto a probe and then inserted into the ionization region of the mass spectrometer, typically through a vacuum interlock. The sample is then subjected to any number of desorption processes, such as laser desorption or direct heating, to facilitate vaporization and ionization.
Direct Infusion
A simple capillary or a capillary column is used to introduce a sample as a gas or in solution. Direct infusion is also useful because it can efficiently introduce small quantities of sample into a mass spectrometer without compromising the vacuum. Capillary columns are routinely used to interface separation techniques with the ionization source of a mass spectrometer. These techniques, including gas chromatography (GC) and liquid chromatography (LC), also serve to separate a solution’s different components prior to mass analysis. In gas chromatography, separation of different components occurs within a glass capillary column. As the vaporized sample exits the gas chromatograph, it is directly introduced into the mass spectrometer.
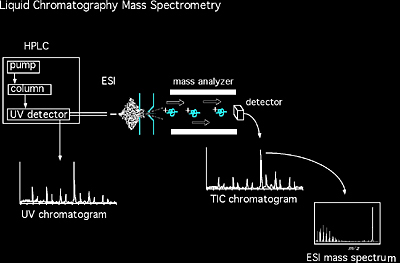
In the 1980s the incapability of liquid chromatography (LC) with mass spectrometry was due largely to the ionization techniques being unable to handle the continuous flow of LC. However, electrospray ionization (ESI), atmospheric pressure chemical ionization (APCI) and atmospheric pressure photoionization (APPI) now allows LC/MS to be performed routinely (Figure 1.4).
Ionization
Ionization method refers to the mechanism of ionization while the ionization source is the mechanical device that allows ionization to occur. The different ionization methods, summarized here, work by either ionizing a neutral molecule through electron ejection, electron capture, protonation, cationization, or deprotonation, or by transferring a charged molecule from a condensed phase to the gas phase.
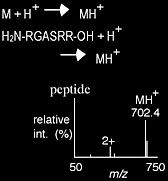
Protonation
Protonation is a method of ionization by which a proton is added to a molecule, producing a net positive charge of 1+ for every proton added. Positive charges tend to reside on the more basic residues of the molecule, such as amines, to form stable cations. Peptides are often ionized via protonation. Protonation can be achieved via matrix-assisted laser desorption/-ionization (MALDI), electrospray ionization (ESI) and atmospheric pressure chemical ionization (APCI).
- Advantages (Positive ions)
- Many compounds will accept a proton to become ionized
- Many ionization sources such as ESI, APCI, FAB, CI and MALDI will generate these species
- Disadvantages
- Some compounds are not stable to protonation (i.e. carbohydrates) or cannot accept a proton easily (i.e. hydrocarbons)
Deprotonation
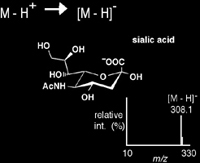
Deprotonation is an ionization method by which the net negative charge of 1- is achieved through the removal of a proton from a molecule. This mechanism of ion-ization, commonly achieved via MALDI, ESI, and APCI is very useful for acidic species including phenols, carboxylic acids, and sulfonic acids. The negative ion mass spectrum of sialic acid is shown in Scheme 1.2.
- Advantages (Negative ions)
- Most useful for compounds that are somewhat acidic
- Many ionization sources such as ESI, APCI, FAB and MALDI will generate these species
- Disadvantages
- Compound specific
Cationization
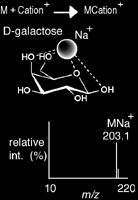
Cationization is a method of ionization that produces a charged complex by non-covalently adding a positively charged ion to a neutral molecule. While protonation could fall under this same definition, cationization is distinct for its addition of a cation adduct other than a proton (e.g. alkali, ammonium). Moreover, it is known to be useful with molecules unstable to protonation. The binding of cations other than protons to a molecule is naturally less covalent, therefore, the charge remains localized on the cation. This minimizes delocalization of the charge and fragmentation of the molecule. Cationization is commonly achieved via MALDI, ESI, and APCI. Carbohydrates are excellent candidates for this ionization mechanism, with Na+ a common cation adduct.
- Advantages (Positive ions)
- Many compounds will accept a cation, such as Na+ or K+ to become ionized
- Many ionization sources such as ESI, APCI, FAB and MALDI will generate these species
- Disadvantages
- Tandem mass spectrometry experiments on cationized molecules will often generate limited or no fragmentation information
Transfer of a charged molecule to the gas phase
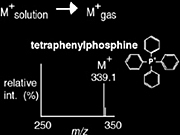
The transfer of compounds already charged in solution is normally achieved through the desorption or ejection of the charged species from the condensed phase into the gas phase. This transfer is commonly achieved via MALDI or ESI. The positive ion mass spectrum of tetraphenylphosphine is shown in Scheme 1.4.
- Advantages (Positive or Negative ions)
- Useful when the compound is already charged
- Many ionization sources such as ESI, APCI, FAB and MALDI will generate these species
- Disadvantages
- Only for precharged ions
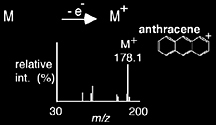
Electron ejection
As its name implies, electron ejection achieves ionization through the ejection of an electron to produce a 1+ net positive charge, often forming radical cations. Observed most commonly with electron ionization (EI) sources, electron ejection is usually performed on relatively nonpolar compounds with low molecular weights and it is also known to generate significant fragment ions. The mass spectrum resulting from electron ejection of anthracene is shown in Scheme 1.5.
- Advantages (Positive ions)
- Observed with electron ionization and can provide molecular mass as well as fragmentation information
- Disadvantages
- Often generates too much fragmentation
- It can be unclear whether the highest mass ion is the molecular ion or a fragment
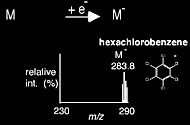
Electron capture
With the electron capture ionization method, a net negative charge of 1- is achieved with the absorption or capture of an electron. It is a mechanism of ion-ization primarily observed for molecules with a high electron affinity, such as halogenated compounds. The electron capture mass spectrum of hexachloro-benzene is shown in Scheme 1.6.
- Advantages (Negative ions)
- Observed with electron ionization and can provide molecular mass as well as fragmentation information
- Disadvantages
- Often generates too much fragmentation
- It can be unclear whether the highest mass ion is the molecular ion or a fragment
Ionization Sources
Prior to the 1980s, electron ionization (EI) was the primary ionization source for mass analysis. However, EI limited chemists and biochemists to small molecules well below the mass range of common bio-organic compounds. This limitation motivated scientists such as John B. Fenn, Koichi Tanaka, Franz Hillenkamp, Michael Karas, Graham Cooks, and Michael Barber to develop the new generation of ionization techniques, including fast atom/ion bombardment (FAB), matrix-assisted laser desorption/ionization (MALDI), and electrospray ionization (ESI) (Table 1.2). These techniques have revolutionized biomolecular analyses, especially for large molecules. Among them, ESI and MALDI have clearly evolved to be the methods of choice when it comes to biomolecular analysis.
| Ionization Source | Acronym | Event |
|---|---|---|
| Electrospray ionization | ESI | Evaporation of charged droplets |
| Nanoelectrospray ionization | nanoESI | Evaporation of charged droplets |
| Atmospheric pressure chemical ionization | APCI | Corona discharge and proton transfer |
| Atmospheric pressure photoionization | APPI | UV light induced ionization |
| Matrix-assisted laser desorption/ionization | MALDI | Photon absorption/proton transfer |
| Desorption/ionization on silicon | DIOS | Photon absorption/proton transfer |
| Fast atom/ion bombardment | FAB | Ion desorption/proton transfer |
| Electron ionization | EI | Electron beam/electron transfer |
| Chemical ionization | CI | Proton transfer |
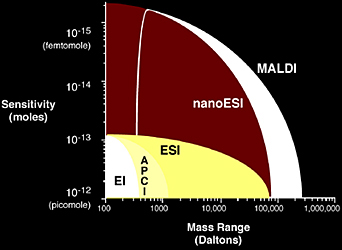
MALDI and ESI are now the most common ionization sources for biomolecular mass spectrometry, offering excellent mass range and sensitivity (Figure 1.5). The following section will focus on the principles of ionization sources, providing some details on the practical aspects of their use as well as ionization mechanisms.
Electrospray Ionization (ESI)
The idea of electrospray, while not new, has been rejuvenated with its recent application to biomolecules. The first electrospray experiments were carried out by Chapman in the late 1930s and the practical development of electrospray ionization for mass spectrometry was accomplished by Dole in the late 1960s. Dole also discovered the important phenomenon of multiple charging of molecules. It was Fenn’s work that ultimately led to the modern day technique of electrospray ionization mass spectrometry and its application to biological macromolecules.
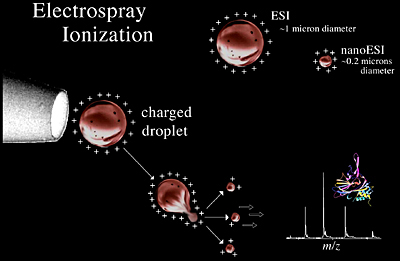
A more physical explanation of ESI is that the needle voltage produces an electrical gradient on the fluid which separates the charges at the surface. This forces the liquid to emerge from the needle as a Taylor cone. The tip of the Taylor cone protrudes as a filament until the liquid reaches the Rayleigh limit where the surface tension and electrostatic repulsion are equal and the highly charged droplets leave the filament. The droplets that break away from the filament are attracted to the entrance of the mass spectrometer due to the high opposite voltage at the mass analyzer's entrance. As the droplet moves towards the analyzers, the Coulombic repulsion on the surface exceeds the surface tension, the droplet explodes into smaller droplets ultimately releasing ions.
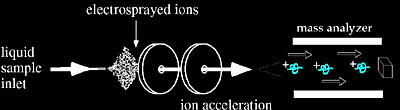
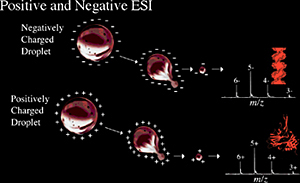
Electrospray ionization (ESI) is a method routinely used with peptides, proteins, carbohydrates, small oligonucleotides, synthetic polymers, and lipids. ESI produces gaseous ionized molecules directly from a liquid solution. It operates by creating a fine spray of highly charged droplets in the presence of an electric field. (An illustration of the electrospray ionization process is shown in Figures 1.6 and 1.7). The sample solution is sprayed from a region of the strong electric field at the tip of a metal nozzle maintained at a potential of anywhere from 700 V to 5000 V. The nozzle (or needle) to which the potential is applied serves to disperse the solution into a fine spray of charged droplets. Either dry gas, heat, or both are applied to the droplets at atmospheric pressure thus causing the solvent to evaporate from each droplet. As the size of the charged droplet decreases, the charge density on its surface increases. The mutual Coulombic repulsion between like charges on this surface becomes so great that it exceeds the forces of surface tension, and ions are ejected from the droplet through a “Taylor cone” Figure 1.7. Another possibility is that the droplet explodes releasing the ions. In either case, the emerging ions are directed into an orifice through electrostatic lenses leading to the vacuum of the mass analyzer. Because ESI involves the continuous introduction of solution, it is suitable for using as an interface with HPLC or capillary electrophoresis.
Electrospray ionization is conducive to the formation of singly charged small molecules, but is also well-known for producing multiply charged species of larger molecules. This is an important phenomenon because the mass spectrometer measures the mass-to-charge ratio (m/z) and therefore multiple charging makes it possible to observe very large molecules with an instrument having a relatively small mass range. Fortunately, the software available with all electrospray mass spectrometers facilitates the molecular weight calculations necessary to determine the actual mass of the multiply-charged species. Figures 1.8 and 1.9 illustrate the different charge states on two different proteins, where each of the peaks in the mass spectra can be associated with different charge states of the molecular ion. Multiple charging has other important advantages in tandem mass spectrometry. One advantage is that upon fragmentation you observe more fragment ions with multiply charged precursor ions than with singly charged precursor ions.
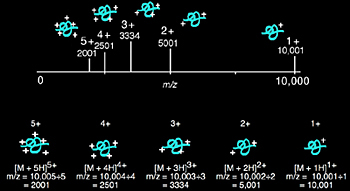
Multiple charging: A 10,000 Da protein and its theoretical mass spectrum with up to five charges are shown in Figure 1.8. The mass of the protein remains the same, yet the m/z ratio varies depending upon the number of charges on the protein. Protein ionization is usually the result of protonation, which not only adds charge but also increases the mass of the protein by the number of protons added. This effect on the m/z applies equally for any mechanism of molecular ionization resulting in a positively or negatively charged molecular ion, including the addition or ejection of charge-carrying species other than protons (e.g. Na+ and Cs+). Multiple positive charges are observed for proteins, while for oligonucleotides negative charging (with ESI) is typical.
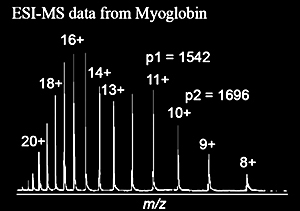
Although electrospray mass spectrometers are equipped with software that will calculate molecular weight, an understanding of how the computer makes such calculations from multiply-charged ions is beneficial. Equations 1.1 - 1.5 and Figure 1.9 offer a simple explanation, where we assume p1 and p2 are adjacent peaks and differ by a single charge, which is equivalent to the addition of a single proton.
| p = m/z p1 = (Mr + z1)/z1 p2 = {Mr + (z1 - 1)}/(z1 - 1) |
(1.1) (1.2) (1.3) |
| p is a peak in the mass spectrum m is the total mass of an ion z is the total charge Mr is the average mass of protein |
p1 is the m/z value for p1 p2 is the m/z value for p2 z1 is the charge on peak p1 |
| Equations 1.2 and 1.3 can be solved for the two unknowns, Mr and z1. For the peaks in the mass spectrum of myoglobin shown in Figure 1.9, p1=1542, and p2=1696. | |
| 1542 z1 = Mr + z1 1696 (z1 - 1) = Mr + (z1 - 1) |
(1.4) (1.5) |
| Solving the two equations: Mr = 16,951 Da for z1 = 11 | |
Electrospray Solvents
Many solvents can be used in ESI and are chosen based on the solubility of the compound of interest, the volatility of the solvent and the solvent's ability to donate a proton. Typically, protic primary solvents such as methanol, 50/50 methanol/water, or 50/50 acetonitrile/H2O are used, while aprotic cosolvents, such as 10% DMSO in water, as well as isopropyl alcohol are used to improve solubility for some compounds. Although 100% water is used in ESI, water's relatively low vapor pressure has a detrimental effect on sensitivity; better sensitivity is obtained when a volatile organic solvent is added. Some compounds require the use of straight chloroform with 0.1% formic acid added to facilitate ionization. This approach, while less sensitive, can be effective for otherwise insoluble compounds.
Buffers such as Na+, K+, phosphate, and salts present a problem for ESI by lowering the vapor pressure of the droplets resulting in reduced signal through an increase in droplet surface tension resulting in a reduction of volatility (see Chapter 3 for quantitative information on salt effects). Consequently, volatile buffers such as ammonium acetate can be used more effectively.
- Advantages
- Practical mass range of up to 70,000 Da
- Good sensitivity with femtomole to low picomole sensitivity typical
- Softest ionization method, capable of generating noncovalent complexes in the gas phase
- Easily adaptable to liquid chromatography
- Easily adaptable to tandem mass analyzers such as ion traps and triple quadrupole instruments
- Multiple charging allows for analysis of high mass ions with a relatively low m/z range instrument
- No matrix interference
- Disadvantages
- The presence of salts and ion-pairing agents like TFA can reduce sensitivity
- Complex mixtures can reduce sensitivity
- Simultaneous mixture analysis can be poor
- Multiple charging can be confusing especially in mixture analysis
- Sample purity is important
- Carryover from sample to sample
Configuration of the Electrospray Ion Source
The off-axis ESI configuration now used in many instruments to introduce the ions into the analyzers (as shown in Figure 1.10) has turned out to be very valuable for high flow rate applications. The primary advantage of this configuration is that the flow rates can be increased without contaminating or clogging the inlet. Off-axis spraying is important because the entrance to the analyzer is no longer being saturated by solvent, thus keeping droplets from entering and contaminating the inlet. Instead, only ions are directed toward the inlet. This makes ESI even more compatible with LC/MS at the milliliter per minute flow rates.
Nanoelectrospray Ionization (NanoESI)
Low flow electrospray, originally described by Wilm and Mann, has been called nanoelectrospray, nanospray, and micro-electrospray. This ionization source is a variation on ESI, where the spray needle has been made very small and is positioned close to the entrance to the mass analyzer (Figure 1.11). The end result of this rather simple adjustment is increased efficiency, which includes a reduction in the amount of sample needed.
The flow rates for nanoESI sources are on the order of tens to hundreds of nanoliters per minute. In order to obtain these low flow rates, nanoESI uses emitters of pulled and in some cases metallized glass or fused silica that have a small orifice (~5µ). The dissolved sample is added to the emitter and a pressure of ~30 PSI is applied to the back of the emitter. Effusing the sample at very low flow rates allows for high sensitivity. Also, the emitters are positioned very close to the entrance of the mass analyzer, therefore ion transmission to the mass analyzer is much more efficient. For instance, the analysis of a 5 mM solution of a peptide by nanoESI would be performed in 1 minute, consuming ~50 femtomoles of sample. The same experiment performed with normal ESI in the same time period would require 5 picomoles, or 100 times more sample than for nanoESI. In addition, since the droplets are typically smaller with nanoESI than normal ESI (Figure 1.11), the amount of evaporation necessary to obtain ion formation is much less. As a consequence, nanoESI is more tolerant of salts and other impurities because less evaporation means the impurities are not concentrated down as much as they are in ESI.
Atmospheric Pressure Chemical Ionization (APCI)
APCI has also become an important ionization source because it generates ions directly from solution and it is capable of analyzing relatively nonpolar compounds. Similar to electrospray, the liquid effluent of APCI (Figure 1.12) is introduced directly into the ionization source. However, the similarity stops there. The droplets are not charged and the APCI source contains a heated vaporizer, which facilitates rapid desolvation/vaporization of the droplets. Vaporized sample molecules are carried through an ion-molecule reaction region at atmospheric pressure.
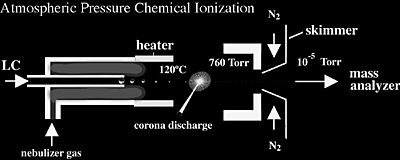
APCI ionization originates from the solvent being excited/ionized from the corona discharge. Because the solvent ions are present at atmospheric pressure conditions, chemical ionization of analyte molecules is very efficient; at atmospheric pressure analyte molecules collide with the reagent ions frequently. Proton transfer (for protonation MH+ reactions) occurs in the positive mode, and either electron transfer or proton loss, ([M-H]-) in the negative mode. The moderating influence of the solvent clusters on the reagent ions, and of the high gas pressure, reduces fragmentation during ionization and results in primarily intact molecular ions. Multiple charging is typically not observed presumably because the ionization process is more energetic than ESI.
Atmospheric Pressure Photoionization (APPI)
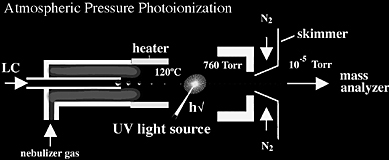
Atmospheric pressure photoionization has recently become an important ionization source because it generates ions directly from solution with relatively low background and is capable of analyzing relatively nonpolar compounds. Similar to APCI, the liquid effluent of APPI (Figure 1.13) is introduced directly into the ionization source. The primary difference between APCI and APPI is that the APPI vaporized sample passes through ultra-violet light (a typical krypton light source emits at 10.0 eV and 10.6 eV). Often, APPI is much more sensitive than ESI or APCI and has been shown to have higher signal-to-noise ratios because of lower background ionization. Lower background signal is largely due to high ionization potential of standard solvents such as methanol and water (IP 10.85 and 12.62 eV, respectively) which are not ionized by the krypton lamp.
A disadvantage of both ESI and APCI is that they can generate background ions from solvents. Additionally, ESI is especially susceptible to ion suppression effects, and APCI requires vaporization temperatures ranging from 350-500° C, which can cause thermal degradation.
APPI induces ionization via two different mechanisms. The first is direct photoexcitation, allowing for electron ejection and the generation of the positive ion radical cation (M+). The APPI source imparts light energy that is higher than the ionization potentials (IPs) of most target molecules, but lower than most of the IPs of air and solvent molecules, thus removing them as interferants. In addition, because little excess energy is deposited in the molecules, there is minimal fragmentation.
The second mechanism is atmospheric pressure photo-induced chemical ionization which is similar to APCI in that it involves charge transfer to produce protonation (MH+) or proton loss ([M-H]-) to generate negative ions.
To initiate chemical ionization, a photoionizable reagent, also called a dopant, is added to the eluant. Upon photoionization of the dopant, charge transfer occurs to the analyte. Typical dopants in positive mode include acetone and toluene. Acetone also serves as a dopant in negative mode.
The ionization mechanism (M+ versus [M+H]+) that a molecule undergoes depends on the proton affinity of the analyte, the solvent, and the type of dopant used.
Matrix-Assisted Laser Desorption/Ionization (MALDI)
Matrix-assisted laser desorption/ionization mass spectrometry (MALDI-MS) was first introduced in 1988 by Tanaka, Karas, and Hillenkamp. It has since become a widespread analytical tool for peptides, proteins, and most other biomolecules (oligonucleotides, carbohydrates, natural products, and lipids). The efficient and directed energy transfer during a matrix-assisted laser-induced desorption event provides high ion yields of the intact analyte, and allows for the measurement of compounds with sub-picomole sensitivity. In addition, the utility of MALDI for the analysis of heterogeneous samples makes it very attractive for the mass analysis of complex biological samples such as proteolytic digests.
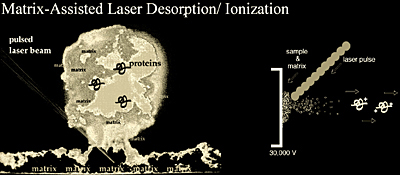
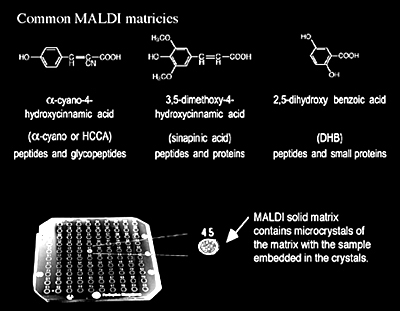
While the exact desorption/ionization mechanism for MALDI is not known, it is generally believed that MALDI causes the ionization and transfer of a sample from the condensed phase to the gas phase via laser excitation and abalation of the sample matrix (Figure 1.14). In MALDI analysis, the analyte is first co-crystallized with a large molar excess of a matrix compound, usually a UV-absorbing weak organic acid. Irradiation of this analyte-matrix mixture by a laser results in the vaporization of the matrix, which carries the analyte with it. The matrix plays a key role in this technique. The co-crystallized sample molecules also vaporize, but without having to directly absorb energy from the laser. Molecules sensitive to the laser light are therefore protected from direct UV laser excitation.
MALDI matrix — A nonvolatile solid material facilitates the desorption and ionization process by absorbing the laser radiation. As a result, both the matrix and any sample embedded in the matrix are vaporized. The matrix also serves to minimize sample damage from laser radiation by absorbing most of the incident energy.
Once in the gas phase, the desorbed charged molecules are then directed electrostatically from the MALDI ionization source into the mass analyzer. Time-of-flight (TOF) mass analyzers are often used to separate the ions according to their mass-to-charge ratio (m/z). The pulsed nature of MALDI is directly applicable to TOF analyzers since the ion's initial time-of-flight can be started with each pulse of the laser and completed when the ion reaches the detector.
Several theories have been developed to explain desorption by MALDI. The thermal-spike model proposes that the ejection of intact molecules is attributed to poor vibrational coupling between the matrix and analyte, which minimizes vibrational energy transfer from the matrix to the vibrational modes of the analyte molecule, thereby minimizing fragmentation. The pressure pulse theory proposes that a pressure gradient from the matrix is created normal to the surface and desorption of large molecules is enhanced by momentum transfer from collisions with these fast moving matrix molecules. It is generally thought that ionization occurs through proton transfer or cationization during the desorption process.
The utility of MALDI for biomolecule analyses lies in its ability to provide molecular weight information on intact molecules. The ability to generate accurate information can be extremely useful for protein identification and characterization. For example, a protein can often be unambiguously identified by the accurate mass analysis of its constituent peptides (produced by either chemical or enzymatic treatment of the sample).
- Advantages
- Practical mass range of up to 300,000 Da. Species of much greater mass have been observed using a high current detector
- Typical sensitivity on the order of low femtomole to low picomole. Attomole sensitivity is possible
- Soft ionization with little to no fragmentation observed
- Tolerance of salts in millimolar concentrations
- Suitable for the analysis of complex mixtures
- Disadvantages
- Matrix background, which can be a problem for compounds below a mass of 700 Da. This background interferences is highly dependent on the matrix material
- Possibility of photo-degradation by laser desorption/ionization
- Acidic matrix used in MALDI my cause degradation on some compounds
Sample-matrix preparation procedures greatly influence the quality of MALDI mass spectra of peptides/proteins (Figure 1.15). Among the variety of reported preparation methods, the dried-droplet method is the most frequently used. In this case, a saturated matrix solution is mixed with the analyte solution, giving a matrix-to-sample ratio of about 5000:1. An aliquot (0.5-2.0 µL) of this mixture is then applied to the sample target where it is allowed to dry. Below is an example of how the dried-droplet method is performed:
- Pipet 0.5 µL of sample to the sample plate.
- Pipet 0.5 µL of matrix to the sample plate.
- Mix the sample and matrix by drawing the combined droplet in and out of the pipette.
- Allow to air dry.
- For peptides, small proteins and most compounds: A saturated solution of α-cyano-4-hydroxycinnamic acid in 50:50 ACN:H2O with 0.1% TFA.
- For proteins and other large molecules: a saturated solution of sinapinic acid in 50:50 ACN:H2O with 0.1% TFA.
- For glycopeptides/proteins and small compounds: a saturated solution of 2,5-dihydroxy benzoic acid (DHB) in 50:50 ACN:H2O.
Alternatively, samples can be prepared in a stepwise manner. In the thin layer method, a homogeneous matrix "film" is formed on the target first, and the sample is then applied and absorbed by the matrix. This method yields good sensitivity, resolving power, and mass accuracy. Similarly, in the thick-layer method, nitrocellulose (NC) is used as the matrix additive; once a uniform NC-matrix layer is obtained on the target, the sample is applied. This preparation method suppresses alkali adduct formation and significantly increases the detection sensitivity, especially for peptides and proteins extracted from gels. The sandwich method is another variant in this category. A thin layer of matrix crystals is prepared as in the thin-layer method, followed by the subsequent addition of droplets of (a) aqueous 0.1% TFA, (b) sample and (c) matrix.
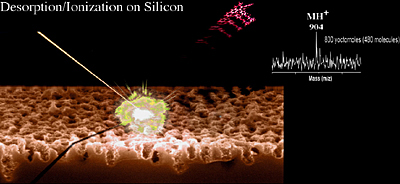
Desorption/Ionization on Silicon (DIOS)
DIOS is a matrix-free method that uses pulsed laser desorption/ionization on silicon (Figure 1.16). Structured silicon surfaces such as porous silicon or silicon nanowires are UV-absorbing semiconductors with a large surface area (hundreds of m2/cm3). For its application to laser desorption/ionization mass spectrometry, the structure of structured silicon provides a scaffold for retaining solvent and analyte molecules, and the UV absorptivity affords a mechanism for the transfer of the laser energy to the analyte. This fortuitous combination of characteristics allows DIOS to be useful for a large variety of biomolecules including peptides, carbohydrates, and small organic compounds of various types. Unlike other direct, matrix-free desorption techniques, DIOS enables desorption/ionization with little or no analyte degradation.
DIOS has a great deal in common with MALDI. Instrumentation and acquisition using DIOS-MS requires only minor adjustments to the MALDI setup; the chips are simply affixed to a machined MALDI plate and inserted into the spectrometer. The same wavelength of laser light (337 nm) typically employed in MALDI is effective for DIOS. While DIOS is comparable to MALDI with respect to its sensitivity, it has several advantages due to the lack of interfering matrix: low background in the low mass range; uniform deposition of aqueous samples; and simplified sample handling. In addition, the chip-based format can be adapted to automated sample handling, where the laser rapidly scans from spot to spot. DIOS could thus accelerate and simplify high-throughput analysis of low molecular weight compounds, as MALDI has done for macromolecules. Because the masses of many low molecular weight compounds can be measured, DIOS-MS can be applied to the analysis of small molecule transformations, both enzymatic and chemical.
In a number of recent advances with DIOS-MS, the modification of the silicon surface with fluorinated silyating reagents have allowed for ultra-high sensitivity in the yoctomole range (Figure 1.16).
Fast Atom/Ion Bombardment (FAB)
Fast atom ion bombardment, or FAB, is an ionization source similar to MALDI in that it uses a matrix and a highly energetic beam of particles to desorb ions from a surface. It is important, however, to point out the differences between MALDI and FAB. For MALDI, the energy beam is pulsed laser light, while FAB uses a continuous ion beam. With MALDI, the matrix is typically a solid crystalline, whereas FAB typically has a liquid matrix. It is also important to note that FAB is about 1000 times less sensitive than MALDI.
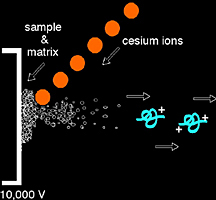
Fast atom bombardment is a soft ionization source which requires the use of a direct insertion probe for sample introduction, and a beam of Xe neutral atoms or Cs+ ions to sputter the sample and matrix from the direct insertion probe surface. It is common to detect matrix ions in the FAB spectrum as well as the protonated or cationized (i.e. M + Na+) molecular ion of the analyte of interest.
FAB matrix — Facilitating the desorption and ionization process, the FAB matrix is a nonvolatile liquid material that serves to constantly replenish the surface with new sample as it is bombarded by the incident ion beam. By absorbing most of the incident energy, the matrix also minimizes sample degradation from the high-energy particle beam.
Two of the most common matrices used with FAB are m-nitrobenzyl alcohol and glycerol:
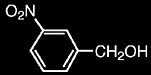
m-nitrobenzyl alcohol (NBA)

glycerol
The fast atoms or ions impinge on or collide with the matrix causing the matrix and analyte to be desorbed into the gas phase. The sample may already be charged and subsequently transferred into the gas phase by FAB, or it may become charged during FAB desorption through reactions with surrounding molecules or ions. Once in the gas phase, the charged molecules can be propelled electrostatically to the mass analyzer.
Electron Ionization (EI)
Electron ionization is one of the most important ionization sources for the routine analysis of small, hydrophobic, thermally stable molecules and is still widely used. Because EI usually generates numerous fragment ions it is a “hard” ionization source. However, the fragmentation information can also be very useful. For example, by employing databases containing over 200,000 electron ionization mass spectra, it is possible to identify an unknown compound in seconds (provided it exists in the database). These databases, combined with current computer storage capacity and searching algorithms, allow for rapid comparison with these databases (such as the NIST database), thus greatly facilitating the identification of small molecules.
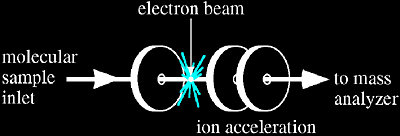
The electron ionization source is straightforward in design (Figure 1.18). The sample must be delivered as a gas which is accomplished by either "boiling off" the sample from a probe via thermal desorption, or by introduction of a gas through a capillary. The capillary is often the output of a capillary column from gas chromatography instrumentation. In this case, the capillary column provides separation (this is also known as gas chromatography mass spectrometry or GC/MS). Desorption of both solid and liquid samples is facilitated by heat as well as the vacuum of the mass spectrometer. Once in the gas phase the compound passes into an electron ionization source, where electrons excite the molecule, thus causing electron ejection ionization and fragmentation.
The utility of electron ionization decreases significantly for compounds above a molecular weight of 400 Da because the required thermal desorption of the sample often leads to thermal decomposition before vaporization is able to occur. The principal problems associated with thermal desorption in electron ionization are 1) involatility of large molecules, 2) thermal decomposition, and 3) excessive fragmentation.
The method, or mechanism, of electron ejection for positive ion formation proceeds as follows:
involatility of large molecules, 2) thermal decomposition, and 3) excessive fragmentation.
The method, or mechanism, of electron ejection for positive ion formation proceeds as follows:
- The sample is thermally vaporized.
- Electrons ejected from a heated filament are accelerated through an electric field at 70 V to form a continuous electron beam.
- The sample molecule is passed through the electron beam.
- The electrons, containing 70 V of kinetic energy (70 electron volts or 70 eV), transfer some of their kinetic energy to the molecule. This transfer results in ionization (electron ejection) with the ion internally retaining usually no more than 6 eV excess energy. M + e- (70 eV) → M+ (~5 eV) + 2e- (~65 eV)
- Excess internal energy (6 eV) in the molecule leads to some degree of fragmentation. M+ → molecular ions + fragment ions + neutral fragments
Electron capture is usually much less efficient than electron ejection, yet it is sometimes used in the following way for high sensitivity work with compounds having a high electron affinity: M + e- → M-.
Chemical Ionization (CI)
Chemical Ionization (CI) is applied to samples similar to those analyzed by EI and is primarily used to enhance the abundance of the molecular ion. Chemical ionization uses gas phase ion-molecule reactions within the vacuum of the mass spectrometer to produce ions from the sample molecule. The chemical ionization process is initiated with a reagent gas such as methane, isobutane, or ammonia, which is ionized by electron impact. High gas pressure in the ionization source results in ion-molecule reactions between the reagent gas ions and reagent gas neutrals. Some of the products of the ion-molecule reactions can react with the analyte molecules to produce ions.
A possible mechanism for ionization in CI occurs as follows:
Reagent (R) + e- → R+ + 2 e-
R+ + RH → RH+ + R
RH+ + Analyte (A) → AH+ + R
In contrast to EI, an analyte is more likely to provide a molecular ion with reduced fragmentation using CI. However, similar to EI, samples must be thermally stable since vaporization within the CI source occurs through heating.
Negative chemical ionization (NCI) typically requires an analyte that contains electron-capturing moieties (e.g., fluorine atoms or nitrobenzyl groups). Such moieties significantly increase the sensitivity of NICI, in some cases 100 to 1000 times greater than that of electron ionization (EI). NCI is probably one of the most sensitive techniques and is used for a wide variety of small molecules with the caveat that the molecules are often chemically modified with an electron-capturing moiety prior to analysis.
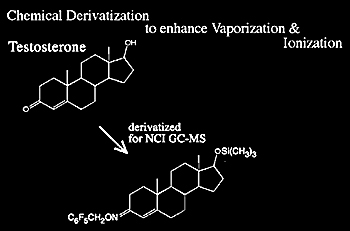
While most compounds will not produce negative ions using EI or CI, many important compounds can produce negative ions and, in some cases, negative EI or CI mass spectrometry is more sensitive and selective than positive ion analysis. In fact, compounds like steroids are modified (Figure 1.19) to enhance NCI.
As mentioned, negative ions can be produced by electron capture, and in negative chemical ionization a buffer gas (such as methane) can slow down the electrons in the electron beam allowing them to be captured by the analyte molecules. The buffer gas also stabilizes the excited anions and reduces fragmentation. Therefore, NCI is in actuality an electron capture process and not what would traditionally be defined as a “chemical ionization” process.
Summary
The mass spectrometer as a whole can be separated into distinct sections that include the sample inlet, ion source, mass analyzer, and detector. A sample is introduced into the mass spectrometer and is then ionized. The ion source produces ions either by electron ejection, electron capture, cationization, deprotonation or the transfer of a charged molecule from the condensed to the gas phase. MALDI and ESI have had a profound effect on mass spectrometry because they generate charged intact biomolecules into the gas phase. In comparison to other ionization sources such as APCI, EI, FAB, and CI, the techniques of MALDI and ESI have greatly extended the analysis capabilities of mass spectrometry to a wide range of compounds with detection capabilities ranging from the picomole to the zeptomole level.
Table 1.5. General Comparison of Ionization Sources
| Ionization Source | Electrospray Ionization (ESI) |
| Typical Mass Range (Da) | 70,000 |
| Matrix Interference | none |
| Degradation | none |
| Complex Mixtures | somewhat limited |
| LC/MS Amenable | excellent |
| Sensitivity | high femtomole to low picomole |
| Comments | Excellent LC/MS tool; low salt tolerance (low millimolar); multiple charging useful, but significant suppression with mixture occurs; low tolerance of mixtures; soft ionization (little fragmentation observed). |
| Ionization Source | NanoESI |
| Typical Mass Range (Da) | 70,000 |
| Matrix Interference | none |
| Degradation | none |
| Complex Mixtures | somewhat limited but better than ESI |
| LC/MS Amenable | OK but low flow rates can present a problem |
| Sensitivity | high zeptomole to low femtomole |
| Comments | Very sensitive and very low flow rates; applicable to LC/MS; but low flow rates require specialized systems; has reasonable salt tolerance (low millimolar); multiple charging useful but significant suppression can occur with mixtures; reasonable tolerance of mixtures; soft ionization (little fragmentation observed). |
| Ionization Source | APCI |
| Typical Mass Range (Da) | 1,200 |
| Matrix Interference | none |
| Degradation | thermal degradation |
| Complex Mixtures | somewhat amenable |
| LC/MS Amenable | excellent |
| Sensitivity | high femtomole |
| Comments | Excellent LC/MS tool; low salt tolerance (low millimolar); useful for hydrophobic materials. |
| Ionization Source | APPI |
| Typical Mass Range (Da) | none |
| Matrix Interference | none |
| Degradation | photo dissociation |
| Complex Mixtures | amenable |
| LC/MS Amenable | excellent |
| Sensitivity | high femtomole |
| Comments | Excellent LC/MS tool; low salt tolerance (low millimolar); useful for hydrophobic materials. |
| Ionization Source | MALDI |
| Typical Mass Range (Da) | 300,000 |
| Matrix Interference | yes |
| Degradation | photo degradation and matrix reactions |
| Complex Mixtures | good for complex mixtures |
| LC/MS Amenable | possible |
| Sensitivity | low to high femtomole |
| Comments | Somewhat tolerant of salts; excellent sensitivity; matrix background can be a problem for low mass ions; soft ionization (little fragmentation observed); photo degradation possible; suitable for complex mixtures. Limited multiple charging occurs so MS/MS data is not extensive. |
| Ionization Source | DIOS |
| Typical Mass Range (Da) | 3,000 |
| Matrix Interference | none |
| Degradation | photo degradation |
| Complex Mixtures | good for complex mixtures |
| LC/MS Amenable | possible |
| Sensitivity | low femtomole to high yoctomole |
| Comments | Somewhat tolerant of salts; excellent sensitivity; soft ionization (little fragmentation observed); photo degradation possible; suitable for complex mixtures and small molecules. |
| Ionization Source | FAB |
| Typical Mass Range (Da) | 7,000 |
| Matrix Interference | yes |
| Degradation | matrix reactions and some thermal degradation |
| Complex Mixtures | somewhat amenable |
| LC/MS Amenable | very limited |
| Sensitivity | nanomole |
| Comments | Relatively insensitive; little fragmentation; soft ionization; high salt tolerance to 0.01M solubility with matrix required. |
| Ionization Source | Electron Ionization (EI) |
| Typical Mass Range (Da) | 500 |
| Matrix Interference | none |
| Degradation | thermal degradation |
| Complex Mixtures | limited unless used with GC/MS |
| LC/MS Amenable | very limited |
| Sensitivity | picomole |
| Comments | Good sensitivity; unique fragmentation data generated; National Institute of Science and Technology (NIST) database (>100,000 compounds) available to compare fragmentation data; thermal decomposition a major problem for biomolecules; limited mass range due to thermal desorption requirement. |
| Ionization Source | Chemical Ionization (CI) |
| Typical Mass Range (Da) | 500 |
| Matrix Interference | none |
| Degradation | thermal degradation |
| Complex Mixtures | limited unless used with GC/MS |
| LC/MS Amenable | very limited |
| Sensitivity | picomole |
| Comments | Offers a softer ionization approach over EI yet still requires thermal desorption; negative CI particularly sensitive for perflourinated derivatives; a limited but powerful approach for certain derivatized molecules such as steroids. |
References
Dole M, Mack LL, Hines RL, Mobley RC, Ferguson LD, Alice MB. Molecular beams of macroions. Journal of Chemical Physics. 1968, 49:5, 2240.
Whitehouse CM, Dreyer RN, Yanashita M, Fenn JB. Electrospray interface for liquid chromatographs and mass spectrometers. Anal. Chem. 1985, 57, 675-679.
Tanaka K, Waki H, Ido Y, Akita S, Yoshida Y, Yoshida T. Protein and polymer analysis up to m/z 100,000 by laser ionization time-of-flight mass spectrometry. Rapid Commun. Mass Spectrom. 1988, 2, 151.
Karas M & Hillenkamp F. Laser desorption ionization of proteins with molecular mass exceeding 10,000 Daltons. Anal. Chem. 1988, 60, 2299.
Bruins AP. Mechanistic aspects of electrospray ionization. J. Chromatogr. A, 1998, 795, 345-357.
Fenn JB, Mann M, Meng CK, Wong SF, Whitehouse CM. Electrospray ionization - principles and practice. Mass Spectrometry Reviews. 1990, 9, 37.
McLafferty FW & Turecek F. Interpretation of Mass Spectra. 4th ed. Mill Valley, Calif. : University Science Books, 1993.
Cole R (Editor). Electrospray Ionization Mass Spectrometry: Fundamentals, Instrumentation, and Applications. New York: Wiley and Sons, 1997.
Cole RB. Some tenets pertaining to electrospray ionization mass spectrometry. J. Mass Spectrom. 2000, 35, 763-772.
Kebarle P. A brief overview of the present status of the mechanisms involved in electrospray mass spectrometry. J. Mass Spectrom. 2000, 35, 804-817.
Gaskell SJ. Electrospray: principles and practice. J. Mass Spectrom. 2000, 35, 677-688.
Cech NB and Enke CG. Practical implications of some recent studies in electrospray ionization fundamentals. Mass Spectrom. Rev. 2001, 20, 362-387.
Mass Analyzers
With the advent of ionization sources that can vaporize and ionize biomolecules, it has become necessary to improve mass analyzer performance with respect to speed, accuracy, and resolution (Figure 2.1). More specifically, quadrupoles, quadrupole ion traps, time-of-flight (TOF), time-of-flight reflectron, and ion cyclotron resonance (ICR) mass analyzers have undergone numerous modifications/improvements over the past decade in order to be interfaced with MALDI and ESI. The biggest challenge came in the ionization of interfacing atmospheric pressure sources (760 torr) to analyzers maintained at 10-6 to 10-11 torr, a remarkable pressure differential of more than 9 orders of magnitude. This chapter will focus on the principles of operation and current performance capabilities of mass analyzers, while briefly touching on ion detectors and the concept of vacuum in a mass spectrometer.
Analytical instruments in general have variations in their capabilities as a result of their individual design and intended purpose. This is also true for mass spectrometers. While all mass spectrometers rely on a mass analyzer, not all analyzers operate in the same way; some separate ions in space while others separate ions by time. In the most general terms, a mass analyzer measures gas phase ions with respect to their mass-to-charge ratio (m/z), where the charge is produced by the addition or loss of a proton(s), cation(s), anion(s) or electron(s). The addition of charge allows the molecule to be affected by electric fields thus allowing its mass measurement. This is an important aspect to remember about mass analyzers -- they measure the m/z ratio, not the mass. It is often a point of confusion because if an ion has multiple charges, the m/z will be significantly less than the actual mass (Figures 1.8 and 1.9). For example, a doubly charged peptide ion of mass 976.5 Daltons (Da) (C37H68N16O142+) has an m/z of 488.3.
Multiple charging is especially common with electrospray ionization, yielding numerous peaks that correspond to the same species yet are observed at different m/z.
The first mass analyzers, made in the early 1900's, used magnetic fields to separate ions according to their radius of curvature through the magnetic field. The design of modern analyzers has changed significantly in the last five years, now offering much higher accuracy, increased sensitivity, broader mass range, and the ability to give structural information. Because ionization techniques have evolved, mass analyzers have been forced to change in order to meet the demands of analyzing a wide range of biomolecular ions with part per million mass accuracy and sub femtomole sensitivity. The characteristics (Table 2.1) of these mass analyzers will be covered in this chapter.
| Mass Analyzers | Event |
|---|---|
| Quadrupole | Scan radio frequency field |
| Quadrupole Ion Trap | Scan radio frequency field |
| Time-of-Flight (TOF) | Time-of-flight correlated directly to ion's m/z |
| Time-of-Flight Reflectron | Time-of-flight correlated directly to ion's m/z |
| Quad-TOF | Radio frequency field scanning and time-of-flight |
| Magnetic Sector | Magnetic field affects radius of curvature of ions |
| Fourier Transform Ion Cyclotron Resonance MS | Translates ion cyclotron motion to m/z (FTMS) |
Performance Characteristics
The performance of a mass analyzer can typically be defined by the following characteristics: accuracy, resolution, mass range, tandem analysis capabilities, and scan speed.
Accuracy
This is the ability with which the analyzer can accurately provide m/z information and is largely a function of an instrument's stability and resolution. For example, an instrument with 0.01% accuracy can provide information on a 1000 Da peptide to ±0.1 Da or a 10,000 Da protein to ±1.0 Da. The accuracy varies dramatically from analyzer to analyzer depending on the analyzer type and resolution. An alternative means of describing accuracy is using part per million (ppm) terminology, where 1000 Da peptide to ±0.1 Da could also be described as 1000.00 Da peptide to ±100 ppm.
Resolution (Resolving Power)
Resolution is the ability of a mass spectrometer to distinguish between ions of different mass-to-charge ratios. Therefore, greater resolution corresponds directly to the increased ability to differentiate ions. The most common definition of resolution is given by the following equation:
Resolution = M/ΔM
...where M corresponds to m/z and ΔM represents the full width at half maximum (FWHM). An example of resolution measurement is shown in Figure 2.2 where the peak has an m/z of 500 and a FWHM of 1. The resulting resolution is M/ΔM = 500/1 = 500.
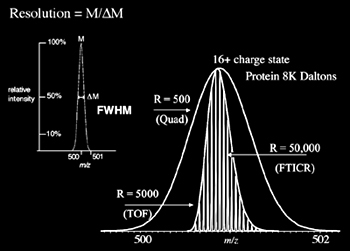
The analyzer's resolving power does, to some extent, determine the accuracy of a particular instrument, as characterized in Figure 2.2. The average mass of a molecule is calculated using the weighted average mass of all isotopes of each constituent element of the molecule. The monoisotopic mass is calculated using the mass of the elemental isotope having the greatest abundance for each constituent element. If an instrument cannot resolve the isotopes it will generate a broad peak with the center representing the average mass. Higher resolution can offer the benefits of separating an ion's individual isotopes or the narrowing of peaks allows a more accurate determination of its position.
Mass Range
This is the m/z range of the mass analyzer. For instance, quadrupole analyzers typically scan up to m/z 3000. A magnetic sector analyzer typically scans up to m/z 10,000 and time-of-flight analyzers have virtually unlimited m/z range.
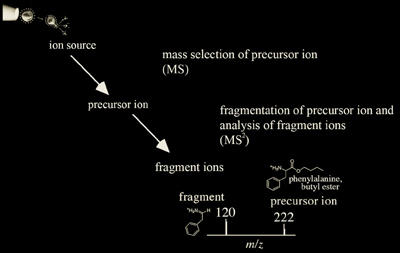
Tandem Mass Analysis (MS/MS or MSn)
This is the ability of the analyzer to separate different molecular ions, generate fragment ions from a selected ion, and then mass measure the fragmented ions. The fragmented ions are used for structural determination of original molecular ions.
Typically, tandem MS experiments are performed by colliding a selected ion with inert gas molecules such as argon or helium, and the resulting fragments are mass analyzed. Tandem mass analysis is used to sequence peptides, and structurally characterize carbohydrates, small oligo-nucleotides, and lipids.
The term "tandem" mass analysis comes from the events being either tandem in space or tandem in time. Tandem mass analysis in space is performed by consecutive analyzers whereas tandem mass analysis in time is performed with the same analyzer, which isolates the ion of interest, fragments it, and analyzes the fragment ions. Tandem analysis characteristics are summarized for the different analyzers in Table 2.2.
Scan Speed
This refers to the rate at which the analyzer scans over a particular mass range. Most instruments require seconds to perform a full scan, however this can vary widely depending on the analyzer. Time-of-flight analyzers, for example, complete analyses in milliseconds or less.
Mass Analyzers
It is clear from Chapter 1 that ESI and MALDI are quite different in terms of how ions are generated. ESI creates ions in a continuous stream from charged droplets under atmospheric pressure conditions and ions are created in a continuous stream, for these reasons quadrupoles presented an well-suited analyzer for ESI since they are both tolerant of relatively high pressures (~10-5 torr) and they are capable of continuously scanning the ESI ion stream. MALDI, on the other hand, generates ions from short, nanosecond laser pulses and is readily compatible with time-of-flight mass analysis, which measures precisely timed ion packets such as those generated from a laser pulse. The most common analyzers are discussed in this section with a description of their respective advantages and disadvantages.
Quadrupoles
Quadrupole mass analyzers (Figure 2.3) have been used with EI sources since the 1950’s and are still the most common mass analyzers in existence today. Interestingly, quadrupole mass analyzers have found new utility in their capacity to interface with ESI and APCI. Quadrupoles offer three main advantages. They tolerate relatively high pressures. Secondly, quadrupoles have a significant mass range with the capability of analyzing up to an m/z of 4000, which is useful because electrospray ionization of proteins and other biomolecules commonly produce charge distributions from m/z 1000 to 3500. Finally, quadrupole mass spectrometers are relatively low cost instruments. Considering the mutually complementary features of ESI and quadrupoles, it is not surprising that the first successful commercial electrospray instruments were coupled with quadrupole mass analyzers.
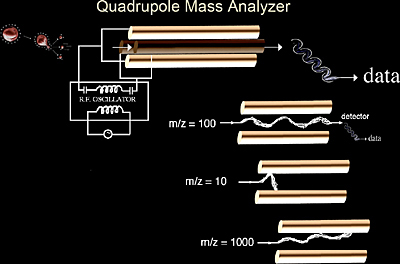
Quadrupole mass analyzers are connected in parallel to a radio frequency (RF) generator and a DC potential. At a specific RF field, only ions of a specific m/z can pass through the quadrupoles as shown in Figure 2.3, where only the ion of m/z 100 is detected. In all three cases in Figure 2.3 the DC and RF fields are the same. Therefore by scanning the RF field a broad m/z range (typically 100 to 4000) can be achieved in approximately one second.
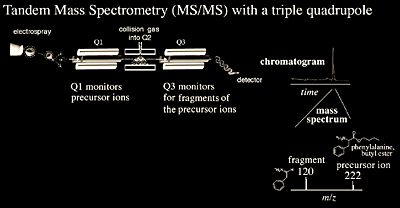
In order to perform tandem mass analysis with a quadrupole instrument, it is necessary to place three quadrupoles in series. Each quadrupole has a separate function: the first quadrupole (Q1) is used to scan across a preset m/z range and select an ion of interest. The second quadrupole (Q2), also known as the collision cell, focuses and transmits the ions while introducing a collision gas (argon or helium) into the flight path of the selected ion. The third quadrupole (Q3) serves to analyze the fragment ions generated in the collision cell (Q2) (Figure 2.4). A stepwise example of collision-induced dissociation (CID), is shown in Scheme 2.1.
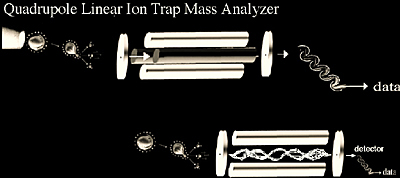
Quadrupole Ion Trap
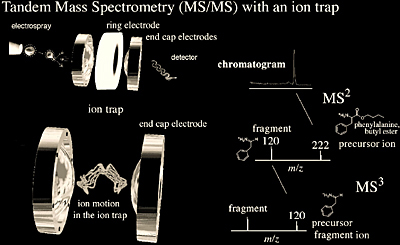
The ion trap mass analyzer shown in Figure 2.5 (roughly the size of a tennis ball) was conceived at the same time as the quadrupole mass analyzer by the same person, Wolfgang Paul. Incidentally, the physics behind both of these analyzers is similar. However, in an ion trap, rather than passing through a quadrupole analyzer with a superimposed radio frequency field, the ions are trapped in a radio frequency quadrupole field. One method of using an ion trap for mass spectrometry involves generating ions internally with EI, followed by mass analysis. Another, more popular, method of using an ion trap for mass spectrometry involves generating ions externally with ESI or MALDI and using ion optics for sample injection into the trapping volume. The quadrupole ion trap typically consists of a ring electrode and two hyperbolic endcap electrodes (Figure 2.5). The motion of the ions induced by the electric field on these electrodes allows ions to be trapped or ejected from the ion trap. In the normal mode, the radio frequency is scanned to resonantly excite and therefore eject ions through small holes in the endcap to a detector. As the RF is scanned to higher frequencies, higher m/z ions are excited, ejected, and detected.
A very useful feature of ion traps is that it is possible to isolate one ion species by ejecting all others from the trap. The isolated ions can subsequently be fragmented by collisional activation and the fragments detected. The primary advantage of quadrupole ion traps is that multiple collision induced dissociation experiments can be performed quickly without having multiple analyzers, such that real time LC-MS/MS is now routine. Other important advantages of quadrupole ion traps include their compact size, and their ability to trap and accumulate ions to provide a better ion signal.
Quadrupole ion traps have been utilized in a number of applications ranging from electrospray ionization MSn (Figure 2.5) of biomolecules to their more recent interface with MALDI. MSn allows for multiple MS/MS experiments to be performed on subsequent fragment ions, providing additional fragmentation information. Yet, ion traps most important application has been in the characterization of proteins. LC-MS/MS experiments are performed on proteolytic digests which provide both MS and MS/MS information. This information allows for protein identification and post-translational modification characterization. The mass range (~4000 m/z) of commercial LC-traps is well matched to m/z values generated from the electrospray ionization of peptides and the resolution allows for charge state identification of multiply-charged peptide ions. Quadrupole ion trap mass spectrometers can analyze peptides from a tryptic digest present at the 20-100 fmol level. Another asset of the ion trap technique for peptide analysis is the ability to perform multiple stages of mass spectrometry, which can significantly increase the amount of structural information.
Linear Ion Trap
The linear ion trap differs from the 3D ion trap (Figure 2.6) as it confines ions along the axis of a quadrupole mass analyzer using a two-dimensional (2D) radio frequency (RF) field with potentials applied to end electrodes. The primary advantage to the linear trap over the 3D trap is the larger analyzer volume lends itself to a greater dynamic ranges and an improved range of quantitative analysis.
Ion Trap's Limitations: Precursor ion scanning, "1/3 rule" & Dynamic range
Given the power of the ion trap the major limitations of this device that keep it from being the ultimate tool for pharmacokinetics and proteomics include the following: 1) the ability to perform high sensitivity triple quadrupole-type precursor ion scanning and neutral loss scanning experiments is not possible with ion traps. 2) The upper limit on the ratio between precursor m/z and the lowest trapped fragment ion is ~0.3 (also known as the "one third rule"). An example of the one third rule is that fragment ions of m/z 900 will not be detected below m/z 300, presenting a significant limitation for de novo sequencing of peptides. 3) The dynamic range of ion traps are limited because when too many ions are in the trap, space charge effects diminish the performance of the ion trap analyzer. To get around this, automated scans can rapidly count ions before they go into the trap, therefore limiting the number of ions getting in. Yet this approach presents a problem when an ion of interest is accompanied by a large background ion population.
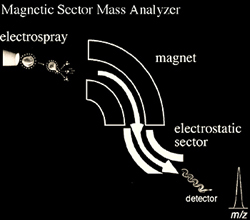
Double-Focusing Magnetic Sector
The earliest mass analyzers separated ions with a magnetic field. In magnetic analysis, the ions are accelerated into a magnetic field using an electric field. A charged particle traveling through a magnetic field will travel in a circular motion with a radius that depends on the speed of the ion, the magnetic field strength, and the ion's m/z. A mass spectrum is obtained by scanning the magnetic field and monitoring ions as they strike a fixed point detector. A limitation of magnetic analyzers is their relatively low resolution. In order to improve this, magnetic instruments were modified with the addition of an electrostatic analyzer to focus the ions. These are called double-sector or two-sector instruments. The electric sector serves as a kinetic energy focusing element allowing only ions of a particular kinetic energy to pass through its field irrespective of their mass-to-charge ratio. Thus, the addition of an electric sector allows only ions of uniform kinetic energy to reach the detector, thereby decreasing the kinetic energy spread, which in turn increases resolution. It should be noted that the corresponding increase in resolution does have its costs in terms of sensitivity. These double-focusing (Figure 2.7) mass analyzers are used with ESI, FAB and EI ionization, however they are not widely used today primarily due to their large size and the success of time-of-flight, quadrupole and FTMS analyzers with ESI and MALDI.
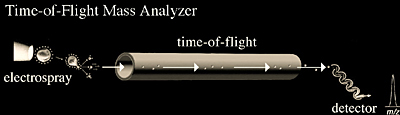
Quadrupole Time-of-Flight Tandem MS
The linear time-of-flight (TOF) mass analyzer (>Figure 2.7) is the simplest mass analyzer. It has enjoyed a renaissance with the invention of MALDI and its recent application to electrospray and even gas chromatography electron ionization mass spectrometry (GC/MS). Time-of-flight analysis is based on accelerating a group of ions to a detector where all of the ions are given the same amount of energy through an accelerating potential. Because the ions have the same energy, but a different mass, the lighter ions reach the detector first because of their greater velocity, while the heavier ions take longer due to their heavier masses and lower velocity. Hence, the analyzer is called time-of-flight because the mass is determined from the ions' time of arrival. Mass, charge, and kinetic energy of the ion all play a part in the arrival time at the detector. Since the kinetic energy (KE) of the ion is equal to 1/2 mv2, the ion's velocity can be represented as v = d/t = (2KE/m)1/2. The ions will travel a given distance d, within a time t, where t is dependent upon the mass-to-charge ratio (m/z). In this equation, v = d/t = (2KE/m)1/2, assuming that z = 1. Another representation of this equation to more clearly present how mass is determined is m = 2t2 KE/d2 where KE is constant.
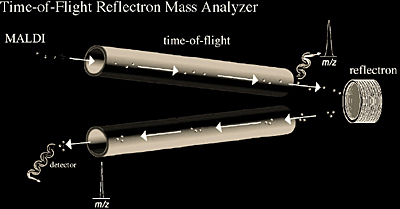
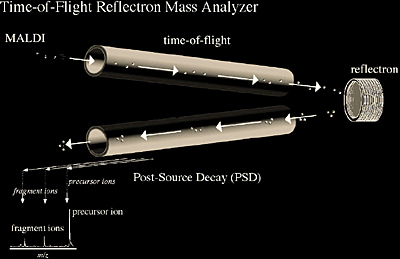
The time-of-flight (TOF) reflectron (Figure 2.8) is now widely used for ESI, MALDI, and more recently for electron ionization in GC/MS applications. It combines time-of-flight technology with an electrostatic mirror. The reflectron serves to increase the amount of time (t) ions need to reach the detector while reducing their kinetic energy distribution, thereby reducing the temporal distribution Δt. Since resolution is defined by the mass of a peak divided by the width of a peak or m/Δm (or t/Δt since m is related to t), increasing t and decreasing Δt results in higher resolution. Therefore, the TOF reflectron offers high resolution over a simple TOF instrument by increasing the path length and kinetic energy focusing through the reflectron. It should be noted that the increased resolution (typically above 5000) and sensitivity on a TOF reflectron does decrease significantly at higher masses (typically above 5000 m/z).
Another type of tandem mass analysis, MS/MS, is also possible with MALDI TOF reflectron mass analyzers. MS/MS is accomplished by taking advantage of MALDI fragmentation that occurs following ionization, or post-source decay (PSD). Time-of-flight instruments alone will not separate post-ionization fragment ions from the same precursor ion because both the precursor and fragment ions have the same velocity and thus reach the detector at the same time. The reflectron takes advantage of the fact that the fragment ions have different kinetic energies and separates them based on how deeply the ions penetrate the reflectron field, thus producing a fragment ion spectrum (Figure 2.9 and 2.10).
It should be noted that electrospray has also been adapted to TOF reflectron analyzers, where the ions from the continuous ESI source can be stored in the hexapole (or octapole) ion guide then pulsed into the TOF analyzer. Thus, the necessary electrostatic pulsing creates a time zero from which the TOF measurements can begin.
MALDI Time-Of-Flight MS
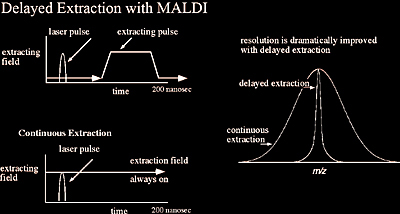
In the initial stages of MALDI-TOF development, these instruments had relatively poor resolution which severely limited their accuracy. An innovation that has had a dramatic effect on increasing the resolving power of MALDI time-of-flight instruments has been delayed extraction (DE), as shown in Figure 2.11. In theory, delayed extraction is a relatively simple means of cooling and focusing the ions immediately after the MALDI ionization event, yet in practice it was initially a challenge to pulse 10,000 volts on and off within a nanosecond time scale. In traditional MALDI instruments, the ions were accelerated out of the ionization source immediately as they were formed. However, with delayed extraction the ions are allowed to “cool” for ~150 nanoseconds before being accelerated to the analyzer. This cooling period generates a set of ions with a much smaller kinetic energy distribution, ultimately reducing the temporal spread of ions once they enter the TOF analyzer. Overall, this results in increased resolution and accuracy. The benefits of delayed extraction significantly diminish with larger macromolecules such as proteins (>30,000 Da).
Quadrupole Time-of-Flight MS
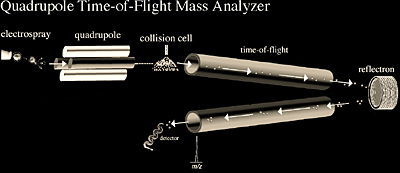
Quadrupole-TOF mass analyzers are typically coupled to electrospray ionization sources and more recently they have been successfully coupled to MALDI. The ESI quad-TOF (Figure 2.12) combines the stability of a quadrupole analyzer with the high efficiency, sensitivity, and accuracy of a time-of-flight reflectron mass analyzer. The quadrupole can act as any simple quadrupole analyzer to scan across a specified m/z range. However, it can also be used to selectively isolate a precursor ion and direct that ion into the collision cell. The resultant fragment ions are then analyzed by the TOF reflectron mass analyzer. Quadrupole-TOF exploits the quadrupole’s ability to select a particular ion and the ability of TOF-MS to achieve simultaneous and accurate measurements of ions across the full mass range. This is in contrast to conventional analyzers, such as tandem quadrupoles, which must scan over one mass at a time. Quadrupole-TOF analyzers offer significantly higher sensitivity and accuracy over tandem quadrupole instruments when acquiring full fragment mass spectra.
The quadrupole-TOF instrument can use either the quadrupole or TOF analyzers independently or together for tandem MS experiments. The TOF component of the instrument has an upper m/z limit in excess of 10,000. The high resolving power (~10,000) of the TOF also enables good mass measurement accuracy on the 10 ppm level. Due to its high accuracy and sensitivity, the ESI quad-TOF mass spectrometer is being incorporated into both proteomics and pharmacokinetics problem solving.
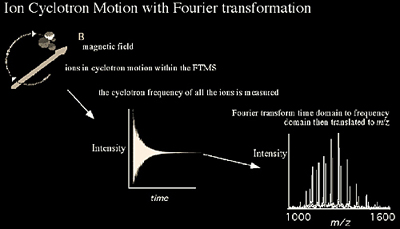
Fourier Transform Mass Spectrometry (FTMS)
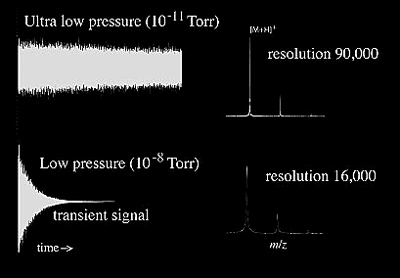
FTMS is based on the principle of monitoring a charged particle's orbiting motion in a magnetic field (Figure 2.13-14). While the ions are orbiting, a pulsed radio frequency (RF) signal is used to excite them. This RF excitation allows the ions to produce a detectable image current by bringing them into coherent motion and enlarging the radius of the orbit. The image current generated by all of the ions can then be Fourier-transformed to obtain the component frequencies of the different ions, which correspond to their m/z. Because the frequencies can be obtained with high accuracy, their corresponding m/z can also be calculated with high accuracy. It is important to note that a signal is generated only by the coherent motion of ions under ultra-high vacuum conditions (10-11 - 10-9 Torr). This signal has to be measured for a minimum time (typically 500 ms to 1 second) to provide high resolution. As pressure increases, signal decays faster due to loss of coherent motion due to collisions (e.g. in ~ <150 ms) and does not allow for high resolution measurements (Figure 2.14).
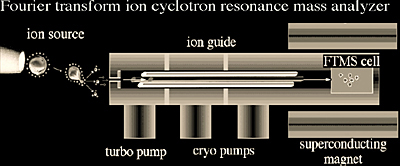
Ions undergoing coherent cyclotron motion between two electrodes are illustrated in Figure 2.13. As the positively charged ions move away from the top electrode and closer to the bottom electrode, the electric field of the ions induces electrons in the external circuit to flow and accumulate on the bottom electrode. On the other half of the cyclotron orbit, the electrons leave the bottom electrode and accumulate on the top electrode as the ions approach. The oscillating flow of electrons in the external circuit is called an image current. When a mixture of ions with different m/z values are all simultaneously accelerated, the image current signal at the output of the amplifier is a composite transient signal with frequency components representing each m/z value. In short, all of the ions trapped in the analyzer cell are excited into a higher cyclotron orbit, using a radio frequency pulse. The composite transient image current signal of the ions as they relax is acquired by a computer and a Fourier transform is used to separate out the individual cyclotron frequencies. The effect of pressure on the signal and resolution is demonstrated in Figure 2.14.
In addition to high resolution, FTMS also offers the ability to perform multiple collision experiments (MSn). FTMS is capable of ejecting all but the ion of interest. The selected ion is then subjected to a collision gas (or another form of excitation such as laser light or electron capture) to induce fragmentation. Mass analysis can then be carried out on the fragments to generate a fragmentation spectrum. The high resolution of FTMS/MS also yields high-accuracy fragment masses.
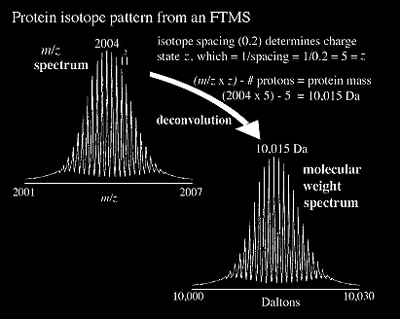
FTMS is a relative neophyte to biomolecular analysis, yet many of its advantages are generating more and more interest. It is now becoming more common to couple ultrahigh resolution (>105) FTMS to a wide variety of ionization sources, including MALDI, ESI, APCI, and EI. The result of an FTMS analyzer's high resolving power is high accuracy (often at the part per million level) as illustrated for a protein in Figure 2.15 where individual isotopes can be observed. The Fourier transform of the ICR signal greatly enhances the utility of ICR by simultaneously measuring all the overlaying frequencies produced by the ions within the ICR cell. The individual frequencies can then be easily and accurately translated into the ion's m/z.
In general, increasing magnetic field (B) has a favorable effect on performance. The Fourier transform of the ICR signal, by measuring overlaying frequencies simultaneously, allows for high resolution and high mass accuracy without compromising sensitivity. This is in sharp contrast to double sector instruments that suffer from a loss in sensitivity at the highest resolution and accuracy. The high resolution capabilities of FTMS are directly related to the magnetic field of the FTMS superconducting magnet, with the resolution increasing as a linear function of the field. The ion capacity as well as MS/MS kinetic energy experiments increases as a square of the magnetic therefore improving dynamic range and fragmentation data. One challenge in increasing B is the magnetic mirror effect where ion transmission to the inside of magnetic field becomes more difficult due to magnetic field lines. Also, manufacturing high field magnets with larger bores and excellent field homogeneity (in the ICR housing) becomes technically more difficult.
FTMS instrumentation is affected by the magnetic field in the following ways:
| FTMS attribute | Effect of Magnetic Field Strength B | What it means: |
|---|---|---|
| Resolution (m/Δm) | Directly proportional to B | Improves mass accuracy and the ability to get isotopic resolution on large macromolecules. |
| Kinetic energy | Directly proportional to B2 | Increases the fragmentation and also ability to fragment larger macromolecules. |
| Ion capacity | Directly proportional to B2 | Can store more ions before space-charge adversely affects performance. |
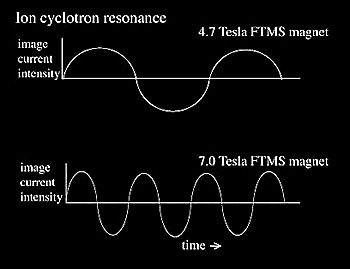
Because ion frequency = K*B*z/m, larger magnetic fields provide a higher frequency for the same m/z, therefore more data points are generated to define the frequency more precisely which ultimately increases accuracy (Figure 2.17).
Quadrupole-FTMS and quadrupole linear ion trap-FTMS mass analyzers that have recently been introduced are typically coupled to electrospray ionization sources. The quad-FTMS combines the stability of a quadrupole analyzer with the high accuracy of a FTMS. The quadrupole can act as any simple quadrupole analyzer to scan across a specified m/z range. However, it can also be used to selectively isolate a precursor ion and direct that ion into the collision cell or the FTMS. The resultant precursor and fragment ions can then be analyzed by the FTMS.
Performing MS/MS experiments outside the magnet presents some advantages since high resolution in FTMS is dependent on the presence of high vacuum. MS/MS experiments involve collisions at a transiently high pressure (10-6 - 10-7 Torr) that then has to be reduced to achieve high resolution (10-10 - 10-9 Torr). Performing MS/MS experiments outside the cell is thus faster since the ICR cell can be maintained at ultra-high vacuum. This makes the newer hybrid instrument designs are optimum over coupling FTMS/MS to separation techniques such as LC.
| Quadrupole | Ion Trap | Time-of-Flight | Time-of-Flight Reflectron | Magnetic Sector | FTMS | Quadrupole-TOF | |
|---|---|---|---|---|---|---|---|
| Accuracy | 0.01% (100 ppm) | 0.01% (100 ppm) | 0.02 to 0.2% (200 ppm) | 0.001% (10 ppm) | <0.0005% (<5 ppm) | <0.0005% (<5 ppm) | 0.001% (10 ppm) |
| Resolution | 4,000 | 4,000 | 8,000 | 15,000 | 30,000 | 100,000 | 10,000 |
| m/z Range | 4,000 | 4,000 | >300,000 | 10,000 | 10,000 | 10,000 | 10,000 |
| Scan Speed | ~a second | ~a second | milliseconds | milliseconds | ~a second | ~a second | ~a second |
| Tandem MS | MS2 (triple quad) | MSn | MS | MS2 | MS2 | MSn | MS2 |
| Tandem MS Comments | Good accuracy, Good resolution, Low-energy collisions | Good accuracy, Good resolution, Low-energy collisions | Not generally applicable | Precursor ion selection is limited to a wide mass range; growing number of applications | Limited resolution, High-energy collisions | Excellent accuracy and resolution of product ions | Excellent accuracy, Good resolution, Low-energy collisions, High sensitivity |
| General Comments | Low cost, Ease of switching pos/neg ions | Low cost, Ease of switching pos/neg ions, Well-suited MSn | Low cost | Good accuracy, Good resolution | Instrument is massive, Capable of high resolution | High resolution, MSnhigh vacuum, super conducting magnet, expense | Known for high sensitivity and accuracy when used for MS2 |
Detectors
Once the ions are separated by the mass analyzer, they reach the ion detector (Figures 2.1 and 2.18-21), which generates a current signal from the incident ions. The most commonly used detector is the electron multiplier, which transfers the kinetic energy of incident ions to a surface that in turn generates secondary electrons. However, a variety of approaches are used to detect ions depending on the type of mass spectrometer.
Electron Multiplier
Perhaps the most common means of detecting ions involves an electron multiplier (Figure 2.18), which is made up of a series (12 to 24) of aluminum oxide (Al2O3) dynodes maintained at ever increasing potentials. Ions strike the first dynode surface causing an emission of electrons. These electrons are then attracted to the next dynode held at a higher potential and therefore more secondary electrons are generated. Ultimately, as numerous dynodes are involved, a cascade of electrons is formed that results in an overall current gain on the order of one million or higher.
The high energy dynode (HED) uses an accelerating electrostatic field to increase the velocity of the ions. Since the signal on an electron multiplier is highly dependent on ion velocity, the HED serves to increase signal intensity and therefore sensitivity.
- Advantages
- Robust
- Fast response
- Sensitive (≈gains of 106)
- Disadvantages
- Shorter lifetime than scintillation counting (~3 years)
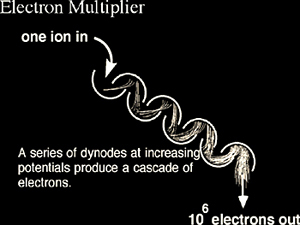
Faraday Cup
A Faraday cup (Figure 2.19) involves an ion striking the dynode (BeO, GaP, or CsSb) surface which causes secondary electrons to be ejected. This temporary electron emission induces a positive charge on the detector and therefore a current of electrons flowing toward the detector. This detector is not particularly sensitive, offering limited amplification of signal, yet it is tolerant of relatively high pressure.
- Advantages
- Good for checking iion transmission and low sensitivity measurements
- Disadvantages
- Low amplification (≈10)
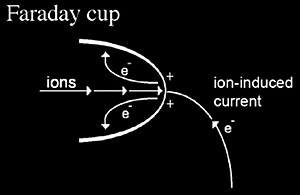
Photomultiplier Conversion Dynode
The photomultiplier conversion dynode detector (Figure 2.20) is not as commonly used at the electron multiplier yet it is similar in design where the secondary electrons strike a phosphorus screen instead of a dynode. The phosphorus screen releases photons which are detected by the photomultiplier. Photomultipliers also operate like the electron multiplier where the striking of the photon on a scintillating surface results in the release of electrons that are then amplified using the cascading principle. One advantage of the conversion dynode is that the photomultiplier tube is sealed in a vacuum, unexposed to the environment of the mass spectrometer and thus the possibility of contamination is removed. This improves the lifetimes of these detectors over electron multipliers. A five-year or greater lifetime is typical, and they have a similar sensitivity to the electron multiplier.
- Advantages
- Robust
- Long lifetime (>5 years)
- Sensitive (≈gains of 106)
- Disadvantages
- Cannot be exposed to light while in operation
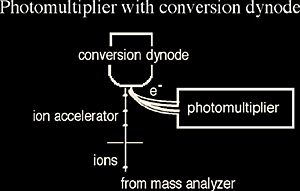
Array Detector
An array detector is a group of individual detectors aligned in an array format. The array detector, which spatially detects ions according to their different m/z, has been typically used on magnetic sector mass analyzers. Spatially differentiated ions can be detected simultaneously by an array detector. The primary advantage of this approach is that, over a small mass range, scanning is not necessary and therefore sensitivity is improved.
- Advantages
- Fast and sensitive
- Disadvantages
- Reduces resolution
- Expensive
Charge (or Inductive) Detector
Charge detectors simply recognize a moving charged particle (an ion) through the induction of a current on the plate as the ion moves past. A typical signal is shown in Figure 2.21. This type of detection is widely used in FTMS to generate an image current of an ion. Detection is independent of ion size and therefore has been used on particles such as whole viruses.
- Advantages
- Detects ions independent of mass and velocity
- Disadvantages
- Limited compatibility with most existing instruments
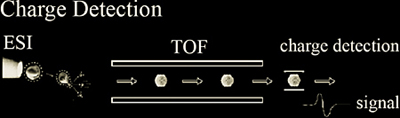
Vacuum in the Mass Spectrometer
All mass spectrometers need a vacuum to allow ions to reach the detector without colliding with other gaseous molecules or atoms. If such collisions did occur, the instrument would suffer from reduced resolution and sensitivity. Higher pressures may also cause high voltages to discharge to ground which can damage the instrument, its electronics, and/or the computer system running the mass spectrometer. An extreme leak, basically an implosion, can seriously damage a mass spectrometer by destroying electrostatic lenses, coating the optics with pump oil, and damaging the detector. In general, maintaining a good vacuum is crucial to obtaining high quality spectra.
One of the first obstacles faced by the originators of mass spectrometry was coupling the sample source to a mass spectrometer. The sample is initially at atmospheric pressure (760 torr) before being transferred into the mass spectrometer’s vacuum (~10-6 torr), which represents approximately a billion-fold difference in pressure. One approach is to introduce the sample through a capillary column (GC) or through a small orifice directly into the instrument. Another approach is to evacuate the sample chamber through a vacuum lock (MALDI) and once a reasonable vacuum is achieved (< 10-2 torr) the sample can be presented to the primary vacuum chamber (< 10-5 torr).
A mass spectrometer is shown in Figure 2.22 with three alternative pumping systems. All three systems are capable of producing a very high vacuum, and are all backed by a mechanical pump. The mechanical pump serves as a general workhorse for most mass spectrometers and allows for an initial vacuum of about 10-3 torr to be obtained. Once a 10-3 torr vacuum is achieved, the other pumping systems, such as diffusion, cryogenic and turbomolecular can be activated to obtain pressures as low as 10-11 torr.
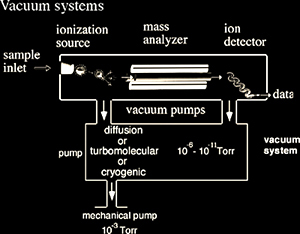
Summary
The mass analyzer is a critical component to the performance of any mass spectrometer. Among the most commonly used are the quadrupole, quadrupole ion trap, time-of-flight, time-of-flight reflectron, and FTMS. However, the list is growing as more specialized analyzers allow for more difficult questions to be addressed. For example, the development of the quad-TOF has demonstrated its superior capabilities in high accuracy tandem mass spectrometry experiments. Once the ions are separated by the mass analyzer they reach the ion detector, which is ultimately responsible for the signal we observe in the mass spectrum.
References
Busch K.L., Glish G.L., McLuckey S.A. Mass Spectrometry/Mass Spectrometry: Techniques and Applications of Tandem. John Wiley & Sons, 1989.
Cotter R. Time-Of-Flight Mass Spectrometry: Instrumentation and Applications in Biological Research. Washington, D.C.: ACS, 1997.
McCloskey J.A. & Simon M.I. Methods in Enzymology: Mass Spectrometry. Academic Press, 1997.
Kinter M. & Sherman NE. Protein Sequencing and Identification Using Tandem Mass Spectrometry. Wiley-Interscience, 2000.